El Niño
Back to main research page
An introduction...
El Niño is a large-scale warming of surface water of the Pacific Ocean every 3–6 years that lasts a few months and dramatically affects weather and climate world wide. It is accompanied by the "Southern Oscillation" in the atmospheric surface pressure over the equatorial Pacific, and together they are referred to as ENSO (more:
wikipedia).
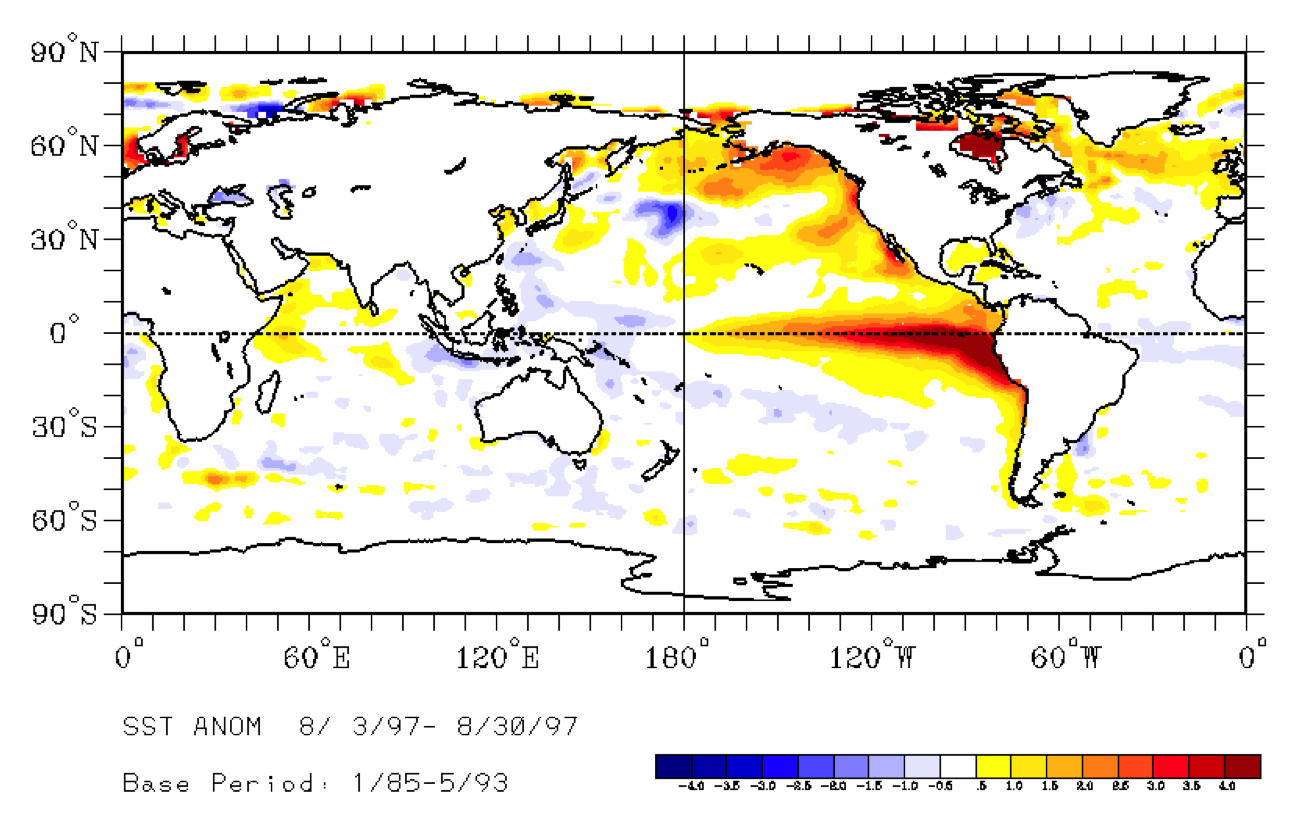
Deviation of the sea surface temperature from a long-term mean during the El Niño event of 1997/8. El Niño is expressed as the large scale warming of 3–4 degrees Celsius seen along the equatorial in the East Pacific Ocean.
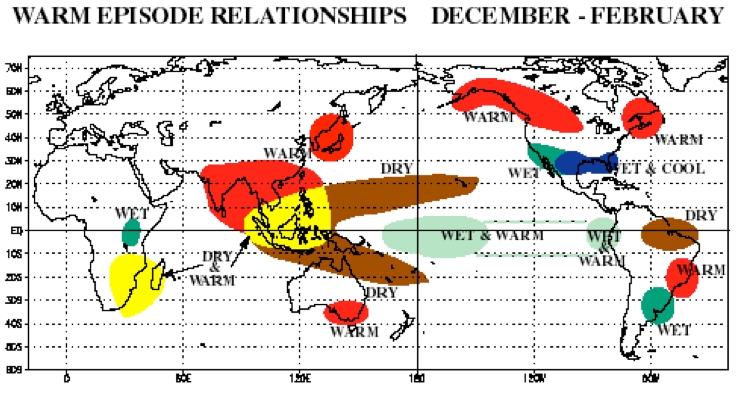
Colored areas in the above map represent regions in which weather is affected by the occurrence of El Niño in the East Pacific (source: NOAA).
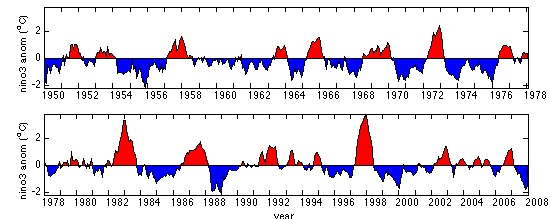
A time series of the sea surface temperature averaged over the eastern tropical Pacific (the "NINO3" index) since 1950. The values plotted are monthly mean temperature anomalies from the mean seasonal cycle.
Irregularity and chaos
El Niño events happen irregularly, which makes their prediction difficult. We proposed that the El Niño cycle may be irregular due to low-order chaotic dynamics driven by the seasonal cycle. In a study based on both a simple heuristic model and a more realistic El Niño prediction model, we suggested that the equatorial Pacific ocean-atmosphere oscillator can go into nonlinear resonance with the seasonal cycle. Furthermore, for a strong enough coupling between the ocean and the atmosphere, the system may become chaotic as a result of irregular jumping of the coupled ocean-atmosphere system between different nonlinear resonances. [See
1,
2].The alternative to this mechanism, suggested by other groups, is that ENSO is irregular because it is forced by stochastic atmospheric forcing, see references in technical papers linked above.
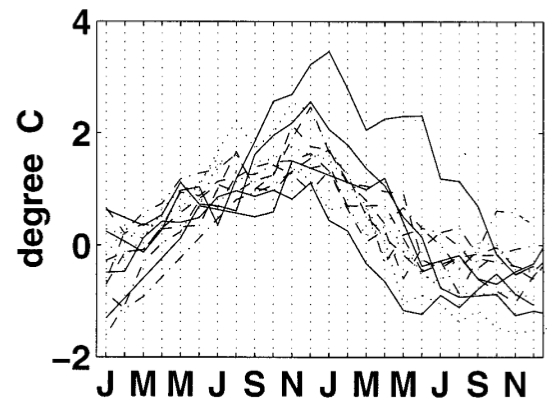
Two-year segments of the observed NINO3 index during several El Niño events, showing that El Niño tends to peak at the end of the calendar year.
Locking to seasonal cycle
In spite of its irregularity, El Niño's tends to peak near the end of the calendar year, as seen in the above figure. We proposed that this may be due to the seasonal amplification of equatorial Rossby and Kelvin ocean waves [
1,
2]
Westerly Wind Bursts
Each major ENSO event seems to be preceded by a few strong "westerly wind bursts" which occur in the west equatorial pacific, last a few days, extend over thousands of km, and seem to be responsible for the event onset. These WWBs seem quite random, but some further analysis we and others have done shows that they may be related to the sea surface temperature and therefore that their characteristics and time of occurrence may be modulated by the large scale ENSO signal itself [
1]. We demonstrated that this modulation strongly affects ENSO's amplitude [
2,
3,
4] and possibly also extends its predictability time. good news... ;-)
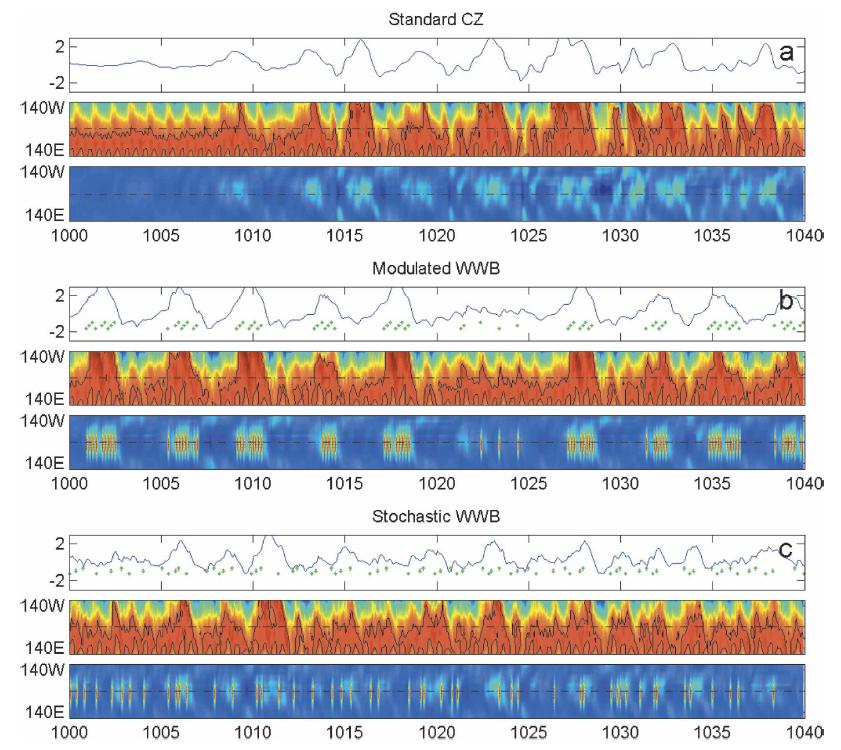
The effects of the modulation of westerly wind bursts by ENSO, demonstrating that this modulation results in a significantly larger amplitude than purely stochastic WWBs.
Controlling El Niño...

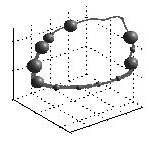
We have used "chaos control" methods to control the chaotic behavior of El Niño in a model that is used successfully for predicting El Niño events in the Equatorial Pacific. The control is obtained by applying small perturbations at a single point in space, and results in El Niño events in the model being periodic rather than chaotic. The ability to control El Niñno in this model proves that El Niñno's regularity in this model is indeed due to chaos rather than other possible factors. In addition, the investigation of the resulting periodic behavior should hopefully improve our understanding of El Niño's dynamics and perhaps our ability to better predict these events. [
1]
A reconstructed phase space plot of an unstable periodic orbit in an El Niño prediction model. This orbit is stabilized using small feedback perturbations, leading to a periodic rather than chaotic model behavior.
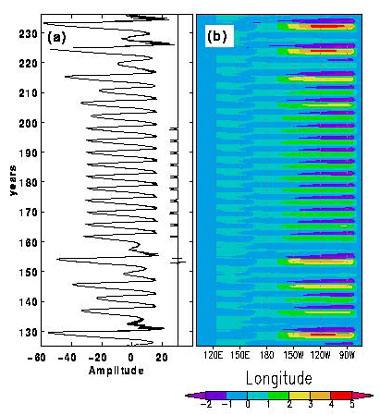
Right panel (b): A plot of the equatorial sea surface temperature as a function of longitude and time during a controlled model run. The behavior is chaotic and of limited predictability during years 120–150 and 200–250, when control is not applied. The controlled, periodic behavior during years 150–200 represents a perfectly periodic and predictable oscillation of the entire equatorial Pacific ocean and atmosphere, with a moderate El Niño every 4.3 years.
Left panel (a): Left curve: a time series of the Kelvin wave amplitude on the western boundary of the Pacific Ocean, to which the control is applied from year 150 to 200. Right curve: the magnitude of the applied control perturbation.
Back to main research page
